Introduction
During the 2026 benefit year renewal season, many of our clients and consultant partners reached out with the same two questions:
Is my Group Medicare renewal increase consistent with others?
How can I reduce the renewal increase with as little disruption to members as possible?
In our latest strategy blog, we answer those questions with internal data and case studies that can inform unions and employers looking to better their outcomes in the upcoming renewal season.
Is my Group Medicare renewal increase consistent with others?
Our Data Set
For the 2026 benefit year, we engaged with 27 insurance carriers to obtain over 1,000 client bids across all of the four major fully-insured Group Medicare products. With these bids, we conducted a rate change analysis from 2025 to 2026 (YoY) by plan product. After looking at the results, we went back and removed drastic outlier bids either above or below a 75% rate change.
Two additional notes about our data set:
- MAPD accounted for 60% of all our client bids in 2026
- Bids with multi-year rate locks that we had negotiated on behalf of our clients affected our findings
Our Findings
Rates were up across all Group Medicare products. MA and MAPD experienced the highest YoY increases, averaging just over 22%. Part D showed the lowest YoY increase at 6.4%. The results below are provided in both percentages and dollar amounts per member per month (PMPM) as well.
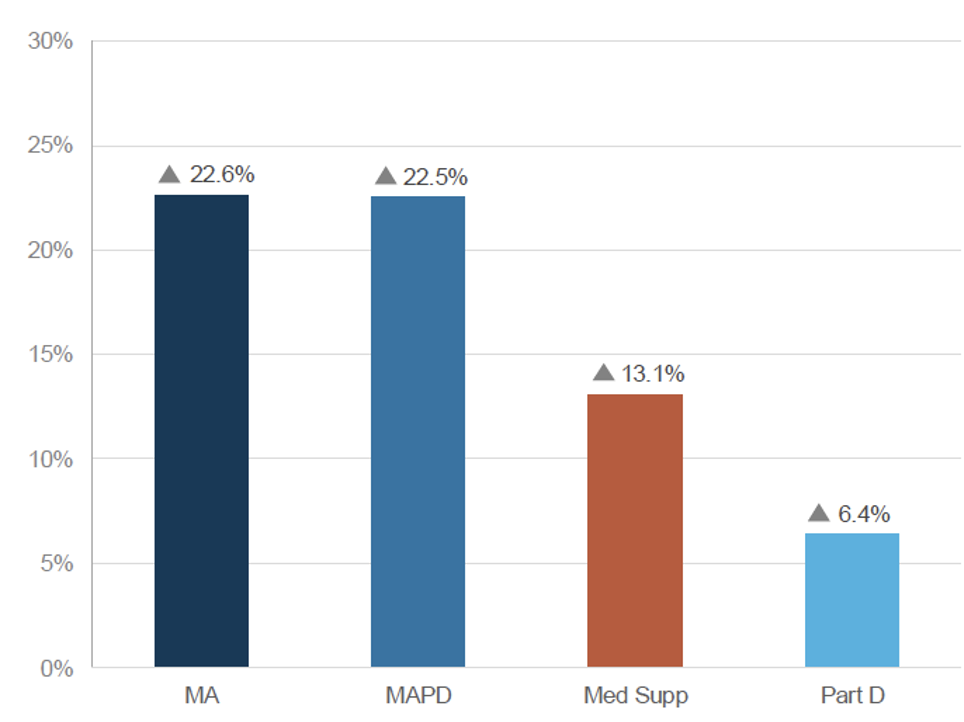
Figure 1: Average Rate Increase of All Client Bids (YoY %)
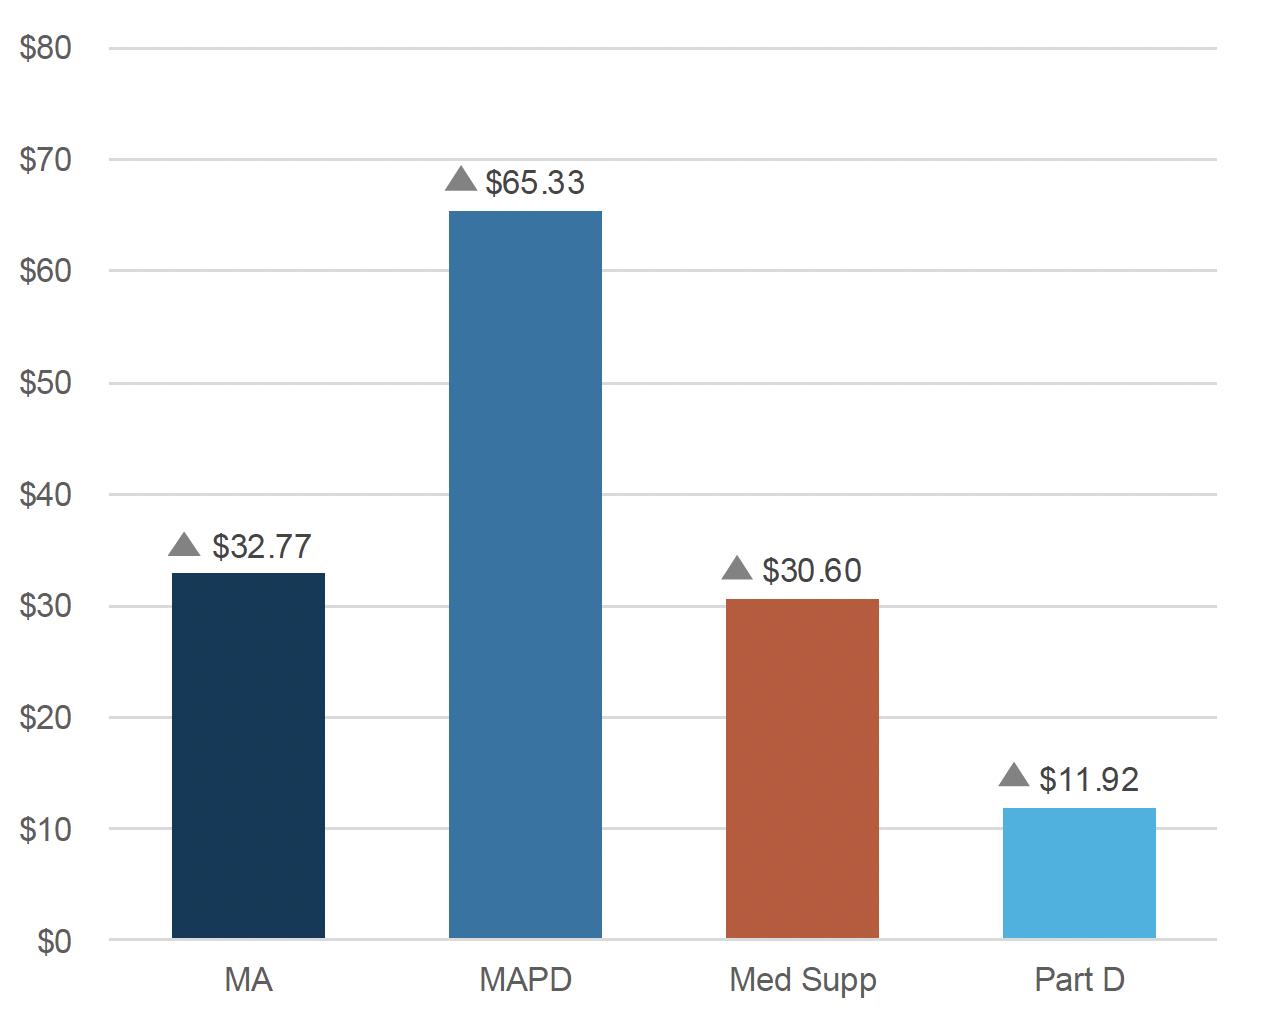
Figure 2: Average Rate Increase of All Client Bids (YoY $)
Due to the fact that 60% of all client bids were for the MAPD product, and location factors into the underlying calculation for the fixed monthly payments each MA plan receives from the federal Centers for Medicare & Medicaid Services (CMS), we reworded the original question for a different look at the data.
Is my Group MAPD renewal increase consistent with similar groups in my area?
Our Findings for MAPD by Region
Here is our same change analysis (YoY %) but only for the MAPD product in a minimum-maximum range by region.
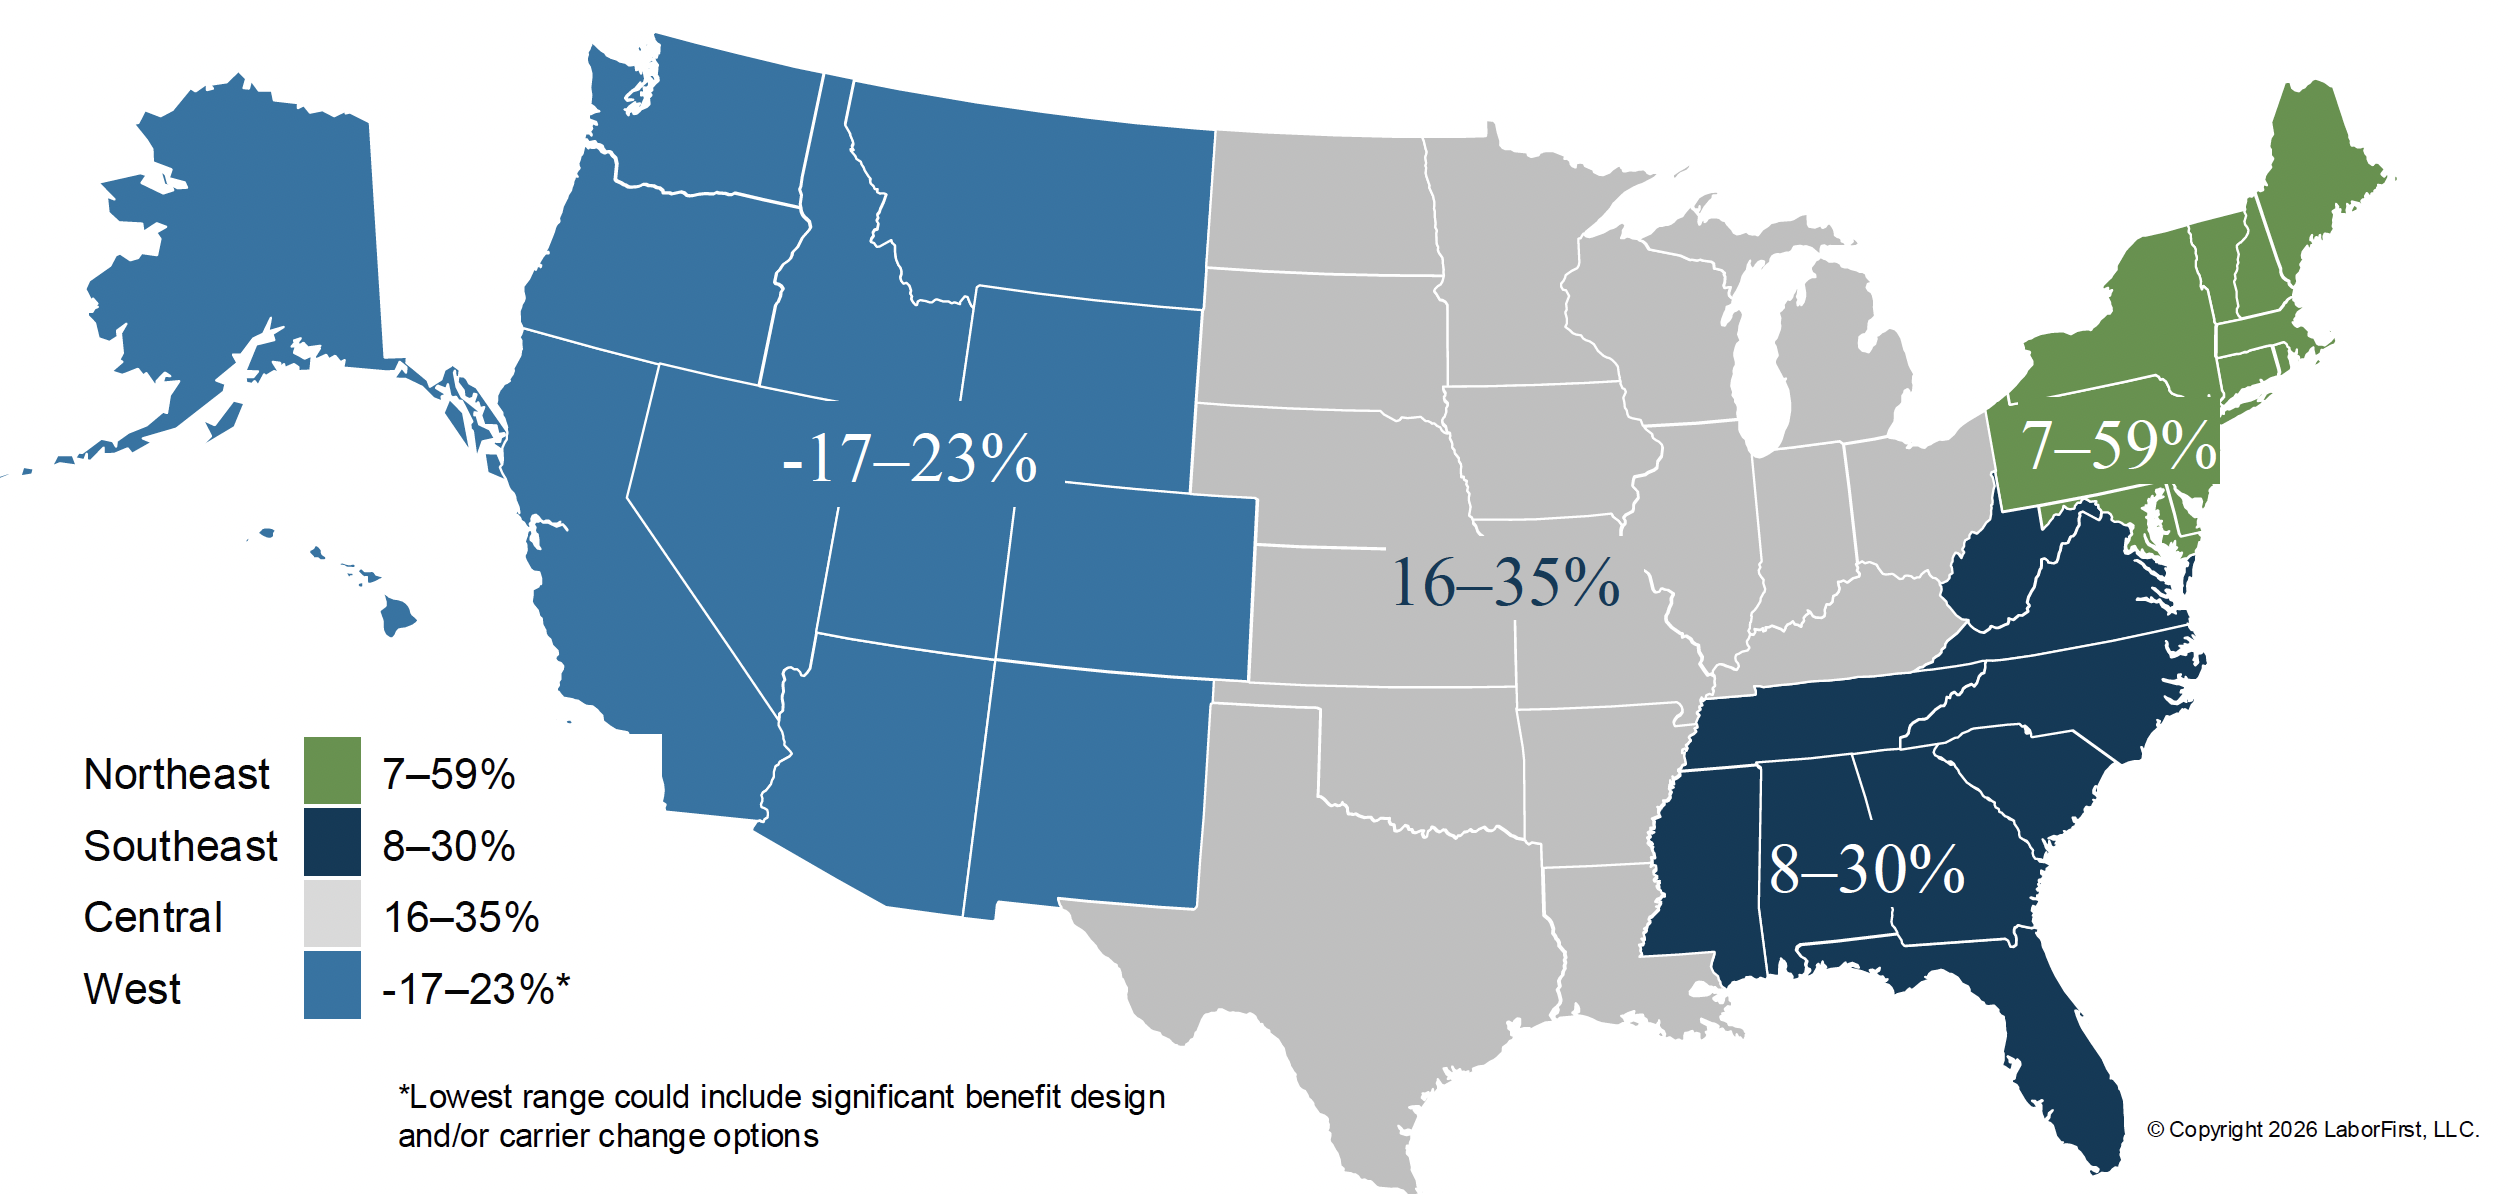
Figure 3: Average Rate Increase of All Client MAPD Bids (YoY %) by Region
The wide range is driven by factors such as zip code, increased utilization, impacts from the IRA and CMS regulatory changes, and benefit design modifications or carrier migration options as we performed market checks for our clients.
Our Findings for Final MAPD Bids
Up to this point, we have only shown averages for all client bids as we worked with our carrier partners to explore their options. By narrowing down our data set from all to only accepted MAPD client bids, we get results that better reflect rates after final negotiation with carriers.
Looking at this data, we see 62% of our MAPD clients ended up with a rate increase at or below 20%, and 37% ended up with a rate increase at or below 10%, despite the difficult market dynamics. While we do see outliers above 50%, those represent just 14% of the renewal block and were driven by unique local markets or provider disruption scenarios.
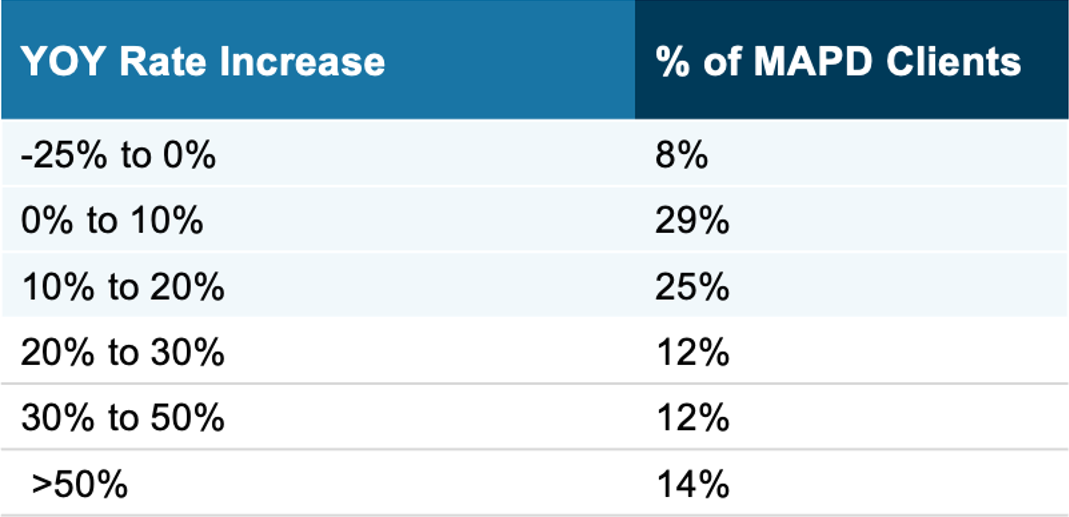
Figure 4: Average Rate Increase of All Client Bids (YoY $)
Returning to our client and consultant partner questions, we will answer the second question.
How can I reduce the renewal increase with as little disruption to members as possible?
Evaluate Your Group Plan Benefits
These are levers to consider:
- Plan product selection
- Plan design
- Carrier selection
Plan Product Selection
Common Product Options for Group Plans
- Medicare Advantage (MA) & Medicare Advantage Prescription Drug (MAPD)
- Medicare Part D Prescription Drug (PDP)
- Group supplement to Medicare
- Coordination of Benefits (COB)
Immediate Priority: Transitioning from Retiree Drug Subsidy (RDS) to Part D
Unions and employers with RDS plans should consider the benefits of transitioning their Medicare-eligible retirees to a Part D plan. LaborFirst gained several new clients in 2026 who had to transition their retiree prescription drug coverage because RDS was no longer a sustainable solution. In one example, a large fund in the northeast had retiree drug coverage that was no longer creditable, or equal in value to the standard Part D benefit baseline that had grown richer after the impact of the IRA. In another example, a private utility company had its Medicare-eligible retirees on the same self-funded pharmacy benefit as their active employees, and the subsidy was no longer offsetting the steep costs. Both of these new clients will save millions of dollars, reduce liability, and now provide ongoing healthcare advocacy for their members through LaborFirst.
Unions and employers should evaluate their RDS plans to ensure they have creditable coverage and review subsidy projections with an actuary to compare with cost savings from a Medicare Part D plan.
Higher CMS Payments to PDP Plans Resulted in an Opportunity to “Unbundle” Medical and Rx Coverage
CMS uses different Fee-for-Service normalization factors for the standalone Part D versus the Part D in the MAPD plan. In the 2026 benefit year, CMS widened the differential. This resulted in a reduction in revenue upwards of around $50 for the Part D portion of the MAPD program (not the standalone Part D.) Additionally, CMS continued with year two of a three-year Part D premium stabilization initiative. The first year of this demonstration project reduced Part D premiums in 2025 by about $15. In the 2026 benefit year, CMS reduced Part D premiums by $10.
This reduction in revenue to MAPD enabled some carriers to offer an “unbundled” option with standalone MA paired with a standalone PDP plan, both with the same carrier. This option was typically extended to larger groups of 2,000+ lives with a premium reduction.
Plan Design
Formulary
Offer à la carte add-ons for non-Part D drugs:
- GLP1s for weight loss only
- Lifestyle drugs
- Cough and cold
- Vitamins and Minerals, etc.
Member Contribution
Explore adjustments:
- Deductibles
- Copays, especially for Urgent Care and ER visits
Carrier Migration
Our clients had less carrier migration in the 2026 benefit year (10%) compared to 2025 (13%). However, the last two years have seen more carrier migration than the pre-IRA benefit year in 2024 (6%).
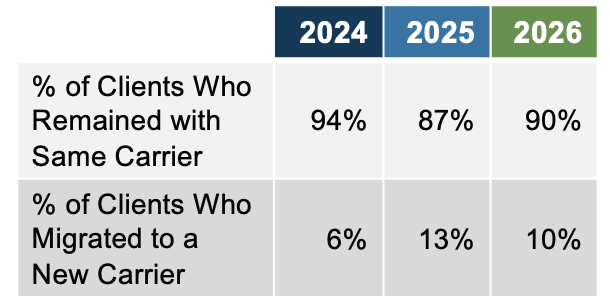
Figure 5: Client Carrier Migration Trend
Breaking down our 2026 carrier migration by product, we see that clients with MAPD plans had the least amount of carrier migration (6%) and clients with group supplement to Medicare had the most (17%).
One factor that reduced carrier migration with MAPD, was that competing carriers either provided higher quotes than the incumbent, or they declined to quote and focused on preserving their client base. One factor that increased migration, was that carriers took this year to “right-size” their book via pricing strategies aligned with their financial goals. In other words, carriers seem willing to lose a client if they didn’t feel the client was performing well from an underwriting perspective.
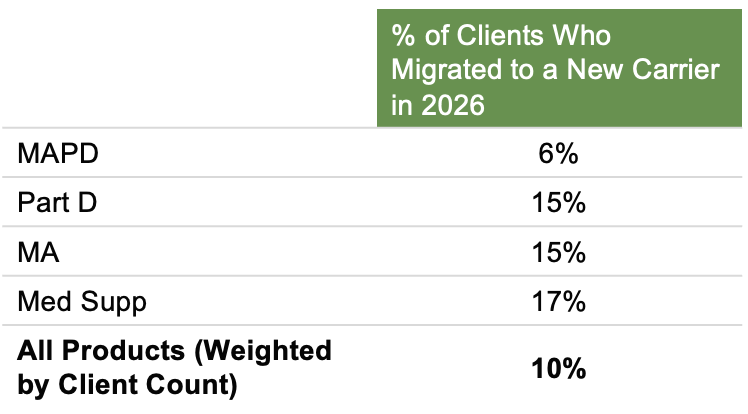
Figure 6: CY 2026 Client Carrier Migration by Product
Carrier migration can cause friction with members, especially without comprehensive services and member advocacy.
The Meaningful Impact of Member Healthcare Advocacy
Change can be difficult for retirees, added to the fact that Medicare is very complex. Proactive outreach about health benefit changes is necessary to ensure a positive member experience and improved health outcomes. Personalized healthcare advocacy is also essential during a time when members need questions answered and issues resolved quickly.
Conclusion
Stay Ahead of the Upcoming Renewal Season
Our data and analysis stress the need for groups to prepare and ensure they have the necessary time to explore retiree benefit changes, obtain competitive options, and fully support members in the upcoming renewal season.
Our advice is to engage an advisor with Medicare expertise early. They can help you monitor the market and regulatory landscape. If groups have access to utilization data, they should have it in hand when facilitating a market check. An advisor can also help identify comprehensive solutions with client and member services that save time, reduce costs, and improve outcomes and satisfaction.
Connect With Us
Learn how our RetireeFirst for Groups solution can maximize benefits and provide world-class services to clients and members.