
This blog is part of our Medicare Overview series for employer-sponsored retiree plans.
Medicare Advantage (MA) is a type of health plan for retirees. It is offered by private companies that contract with Medicare and receive fixed monthly pre-payments for predicted costs. MA payment rates are updated annually through a complex system of benchmarks and bidding. Benchmarks are used as bidding targets by MA plans for individuals (non-group). This article covers local* MA benchmarks and how they are calculated.
The majority of MA plans are either HMOs or PPOs. HMOs are local in that they serve one or more counties. Medicare makes payments based on a local plan’s enrollees’ counties of residence. PPOs can be local or regional. Regional plans must serve all of one of the 26 regions established by the federal Centers for Medicare & Medicaid Services (CMS). Each region comprises one or more entire states.[1]
Group retiree plans, also known as Employer Group Waiver Plans (EGWPs), are employer- or union-sponsored plans that exclusively enroll retirees and their eligible spouses. Medicare will waive certain requirements explicitly for group retiree plans.[2] Employers and unions can offer local PPO and HMO plans to all their Medicare-eligible members nationwide if that plan can meet CMS’s MA network adequacy requirements for at least 51% of their enrollees.[3]
Group retiree plans also don’t submit bids to Medicare. The payment to a group retiree plan is a percentage of the area benchmark based on the bid-to-benchmark ratios of the bids of non-group plans.[4]
Original Medicare FFS Spending as a Baseline
An MA local benchmark is the maximum amount that Medicare will pay a plan per enrollee to provide Medicare-covered benefits in a given county. Benchmarks represent what CMS predicts it would cost to cover an average enrollee in a given county under Original Medicare (Parts A & B). Medicare Part A is hospital insurance that covers inpatient care, and Part B is medical insurance that covers outpatient services.
Unlike MA, Original Medicare uses a Fee-For-Service (FFS) model where healthcare providers bill Medicare directly for each covered service or item delivered to an enrollee. MA benchmarks use Original Medicare FFS spending as a baseline.
Calculating County-Level Benchmarks for Payments
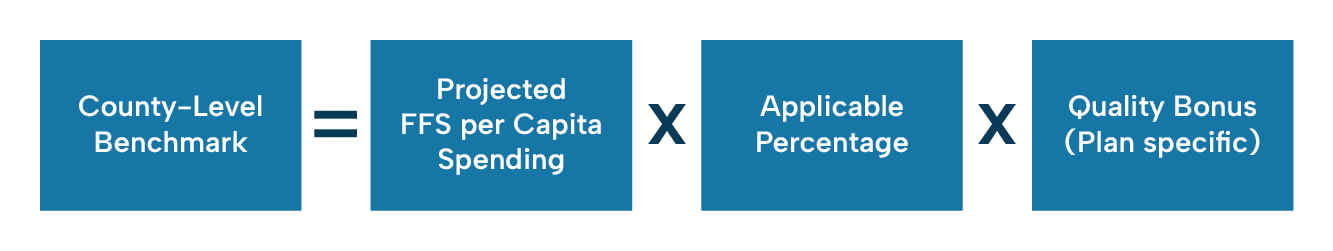
Every year, CMS sets MA benchmarks for each U.S. county. CMS first projects the national per capita (or per person) FFS spending for the coming year, known as the FFS United States Per Capita Cost (USPCC). To calculate projected FFS per capita spending by county, CMS multiplies the projected FFS USPCC by a geographic index called the average geographic adjustment (AGA)[5]. This rate is multiplied by an applicable percentage and potentially a quality bonus. The calculation is as follows:
All counties are divided into four groups, or quartiles, based on how expensive the area’s FFS costs are. Each quartile has an applicable percentage ranging from 95–115%. These percentages are applied to balance out payments: counties with low FFS costs have a higher percentage to make less profitable areas more attractive to plans; counties with high FFS costs have a smaller percentage to reduce overpayment and encourage efficiency.
Quartiles with Applicable Percentages
1st Quartile, Lowest FFS costs: 115%
2nd Quartile, Low FFS costs: 107.5%
3rd Quartile, High FFS costs: 100%
4th Quartile, Highest FFS costs: 95%[6]
Quality Bonuses, also called Star Rating Bonuses or Quality Bonus Payments (QBP), are part of the MA quality bonus program, established by the Affordable Care Act (ACA). Plans with a 4.0 star rating or higher receive a bonus, usually a 5% increase to their benchmark. High-quality plans in “double-bonus counties” with low FFS costs and high MA enrollment, receive a 10% increase. New or low-enrollment plans without star ratings receive a 3.5% increase.[7]
Benchmark payments are capped at their pre-ACA amounts. Caps can reduce or eliminate quality bonuses.
An Example of a County-Level Benchmark
Here are variables for calculating a county-level benchmark:
- Projected FFS per Capita Spending for County X: $1,133.45
- Applicable Percentage: 107.5% (low-cost county in 2nd quartile)
- MA Plan Y: 4.0 Star Rating (5% bonus increase)
Plugging in our variables, we get the following calculation:
County-Level Benchmark =$1,133.45 × 1.075 × 1.05
The county-level benchmark for MA Plan Y with enrollees in County X is $1,279.
CMS releases local and regional benchmarks in an MA ratebook alongside the final rate announcement, published on or before the first Monday in April every year.
___
Sign up for our quarterly newsletter, the LaborFirst Review, to receive the latest industry insights and education as we gear up for Medicare changes in 2026. Scroll down to our footer and enter your email to stay in the loop.
*Benchmarks for regional PPO plans are calculated differently.
[1] MedPAC, 2024. https://www.medpac.gov/wp-content/uploads/2024/10/MedPAC_Payment_Basics_24_MA_FINAL_SEC.pdf
[2] CMS, 2025. https://www.cms.gov/medicare/coverage/prescription-drug-coverage-contracting/employer-group-waiver-plans-egwps
[3] CMS, 2013. CMS Manual System: Pub. 100-16 Medicare Managed Care, Transmittal 111, May 3, 2013.
[4] MedPAC, 2024. https://www.medpac.gov/wp-content/uploads/2024/10/MedPAC_Payment_Basics_24_MA_FINAL_SEC.pdf
[5] The Commonwealth Fund, 2024. https://www.commonwealthfund.org/publications/explainer/2024/mar/how-government-updates-payment-rates-medicare-advantage-plans
[6] MedPAC, 2024. https://www.medpac.gov/wp-content/uploads/2024/10/MedPAC_Payment_Basics_24_MA_FINAL_SEC.pdf
[7] KFF, 2025. https://www.kff.org/medicare/medicare-advantage-quality-bonus-payments/